
News
We will constantly surpass ourselves to create value for clients, strive for winning the long term trust from clients with better products and services!
Predictive Maintenance of Manufacturing Equipment: The 4 Standard Steps of Sensor Data Analysis Technology
The purpose of data analysis in predictive maintenance is to accurately detect signs of equipment degradation present in sensor data.

In the previous article of the "Equipment Maintenance DX through Sensor Data × Data Analysis" series, we explained the overview and key points for introducing Predictive Maintenance (PdM), which has garnered significant attention recently, especially in the field of equipment maintenance.
There are several points to consider when introducing predictive maintenance, one of which is "selecting the appropriate data analysis method." The goal of data analysis in predictive maintenance is to correctly detect signs of equipment degradation evident in sensor data. To achieve this, it is crucial to carefully observe the sensor data, understand the characteristic fluctuation patterns caused by equipment degradation, and select data analysis methods suited to these characteristics.
This article is the second in the "Equipment Maintenance DX through Sensor Data × Data Analysis" series. It focuses on the data analysis for predictive maintenance, providing an easy-to-understand explanation of commonly used data analysis techniques and methods, as well as the series of steps involved—from collecting sensor data to selecting data analysis methods.
- Keywords -
01 Data Analysis Techniques Used in Predictive Maintenance
Commonly used data analysis techniques in predictive maintenance can be categorized into the following three types, along with their characteristics and primary methods:
1. Outlier Detection
Outlier detection primarily judges anomalies based on the quantity of surrounding data points. Common specific methods include:
- k-Nearest Neighbors (k-NN)
Local Outlier Factor (LOF)
2. Anomaly Detection (Fault Detection)
Anomaly detection, i.e., fault detection, judges anomalies based on the degree of deviation from a normal (or abnormal) pattern. Common specific methods include:
- k-Nearest Neighbors (k-NN)
Mahalanobis-Taguchi System (MTS)
3. Change Detection
Change detection judges anomalies based on the degree of deviation from patterns observed at previous times. Common specific methods include:
- k-Nearest Neighbors (k-NN)
Singular Spectrum Transformation (SST)
This article omits detailed explanations of the specific methods. Beyond the data analysis techniques mentioned above, there are also methods like fault classification, which categorizes fault locations and types. However, if you are starting to introduce equipment maintenance DX now, focusing on the three techniques mentioned above is sufficient for the time being.
On the other hand, the specific methods listed represent only a subset; in practice, a wide variety of methods have been proposed, offering many options to choose from.
It is crucial to emphasize that directly selecting these data analysis techniques and specific methods is not a good idea. Often, the initially chosen method turns out to be unsuitable, leading to significant rework and ultimately wasting the cost and time invested in discussions.
To successfully implement predictive maintenance through sensor data × data analysis, it is essential to select and apply techniques and methods suited to the maintenance target equipment and the sensor data obtained from it, from among the technologies and methods mentioned above.
02 The 4 Steps of Data Analysis in Predictive Maintenance
What steps should be followed when analyzing data for predictive maintenance? Let's explain the process based on Figure 1 below.
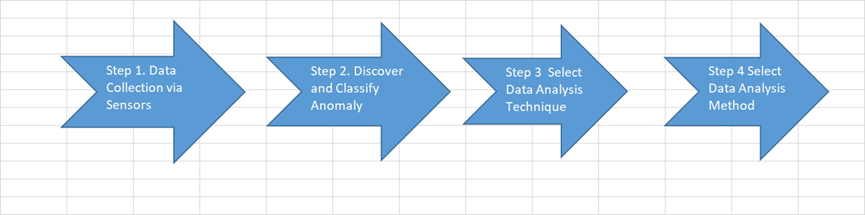
(Image: Figure 1 - Data Analysis Flow in Predictive Maintenance)
Figure 1: Data Analysis Flow in Predictive Maintenance
Step 1. Data Collection via Sensors
Data analysis cannot begin without sensor data for analysis. Therefore, it is necessary to select and install appropriate sensors for the target equipment requiring maintenance, ensuring they are in a state to correctly collect the intended data.
Step 2. Discover and Classify Anomaly Patterns
The next step involves discovering anomaly patterns present in the collected data and classifying them. As an example, Figure 2 shows typical anomaly patterns found in sensor data.
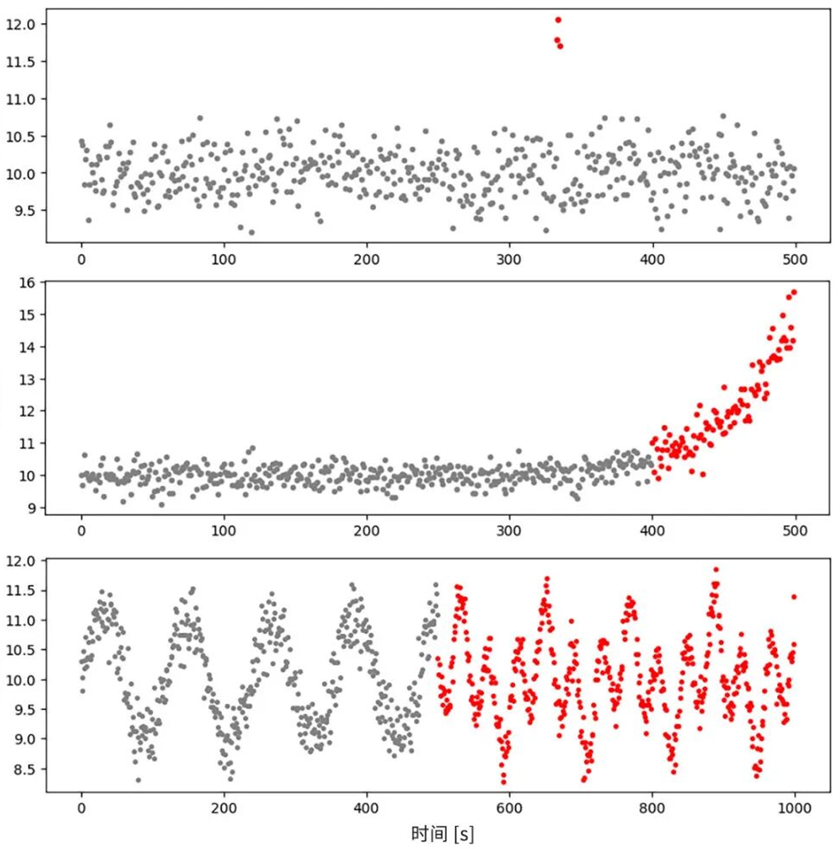
(Image: Figure 2 - Examples of Anomalies in Vibration Sensor Data (Grey: Data during normal operation, Red: Data corresponding to anomaly) Top: Outliers, Middle: Drift, Bottom: Trend Change)
There are many ways to perform Step 2, but data visualization and visual inspection are fundamental and highly effective methods. The classification of observed anomalies into patterns like those in Figure 2 serves as an important criterion for selecting more appropriate data analysis methods (refer to Step 3).
Hereafter, we will proceed under the assumption that the "anomalies" caused by the target factors (equipment degradation or failure, etc.) have been discovered and classified.
In this article, the "anomalies" in focus refer to "all instances where sensor data values or time-series trends differ from those measured during normal equipment operation," encompassing two meanings:
- (a) Anomalies caused by changes due to equipment degradation or failure.
(b) Anomalies caused by changes due to factors other than (a) above. (e.g., changes in personnel, production machinery, materials, methods, etc., due to operational improvements or equipment repair).
In predictive maintenance, anomalies of type (a) are often the monitoring target, so this article will focus on type (a) anomalies.
Furthermore, in practical operation, it is necessary to determine whether a change in sensor data value is a type (a) or type (b) anomaly. However, generally, it is difficult to judge which type has occurred based solely on sensor data, so appropriate reference to maintenance records, etc., is required.
Step 3. Select Data Analysis Technique
After understanding the anomaly patterns in Step 2, the stage of selecting the data analysis technique begins. As mentioned, the manifested anomaly pattern is a crucial criterion for selecting the applicable data analysis technique. Therefore, we introduce suitable data analysis techniques for each pattern shown in Figure 2.
(1) Anomalies Manifesting as Sudden Outliers
If anomalies appear as sudden outliers, as in the top panel of Figure 2, consider applying the data analysis technique known as Outlier Detection. In outlier detection, a data point is judged as anomalous if there are few or no other data points around it (Figure 3). Additionally, if normal labels can be assigned, Anomaly Detection described below in [(2)] can also be considered.
- Characteristic: Does not require labeling data as normal or anomalous, making data collection for applying the technique less difficult.
Note: Higher risk of false detection (misjudging normal data as anomalous).
(Image: Figure 3 - Schematic of Outlier Detection (Grey: Normal operation data, Red: Anomaly data))
Figure 3: Schematic of Outlier Detection
(2) Anomalies Manifesting as Drift
If anomalies involve continuous changes like drift, as in the middle panel of Figure 2, outlier detection may not be suitable, and Anomaly Detection should be considered. In anomaly detection, judgment is based on the degree of deviation from the normal pattern (Figure 4).
Following the same logic, if sufficient anomalous data is available, fault detection—judging anomalies based on similarity to that pattern—could also be considered. However, this requires a certain level of coverage of anomalous data, which is not common, so caution is needed when applying it.
- Characteristic: Detects anomalies based on the degree of deviation from the normal pattern or similarity, allowing it to handle changes like drift.
Note: Requires a clearly defined reference source—the normal pattern—and associated labels, making data collection and preparation slightly more difficult and costly compared to outlier detection. (For fault detection) Applicable only when sufficient anomalous data caused by equipment degradation or failure is available.
(Image: Figure 4 - Schematic of Anomaly Detection (Grey: Normal operation data, Red: Data corresponding to 'anomaly'))
Figure 4: Schematic of Anomaly Detection
(3) Anomalies Manifesting as Trend Changes
If the anomaly involves only a change in trend (slope, period, fluctuation pattern, etc.), with the possible data range not significantly different from normal operation, as in the bottom panel of Figure 2, it might be difficult to apply outlier detection or anomaly detection that judge based on single data points. In this case, consider applying Change Detection.
Change detection differs from the techniques above, as it typically involves evaluating multiple data points simultaneously. It investigates whether a trend change exists by comparing the data set under evaluation with a data set from a slightly earlier time period (Figure 5).
Change detection also includes methods that detect anomalies only when the possible data range continuously deviates from normal operation. This is useful when transient outliers can occur even during normal operation due to the characteristics of the equipment or the measured object.
- Characteristic: Specifically designed to detect anomalies where trend changes occur somewhat continuously.
Note: Not suitable for detecting sudden, one-off anomalies.
(Image: Figure 5 - Schematic of Change Detection (Grey: Normal operation data, Red: Anomaly data))
Figure 5: Schematic of Change Detection
Step 4. Select Data Analysis Method
After selecting the data analysis technique, the next step is to choose a more specific method. Since providing selection criteria covering all methods is impractical, we introduce two general points that should be considered when selecting a method.
1. Assumptions and Prerequisites of the Method
A representative example is methods that assume the data follows a specific distribution. If this prerequisite is not met, it may lead to a situation where anomalies cannot be correctly detected. For instance, the Mahalanobis-Taguchi System, listed as an example method for anomaly detection in Table 1, is a method applicable to various scenarios, but it assumes the data follows a normal distribution. Therefore, if this method is chosen simply because it is commonly used, it will fail to detect anomalies correctly if the target data does not follow a normal distribution. Always thoroughly confirm whether your data satisfies the method's prerequisites.
2. Interpretability of the Method
The ultimate goal of data analysis is predictive maintenance. If an anomaly is judged, a human must use that result to decide whether to perform maintenance. With this in mind, it can be said that priority should be given to methods where the rationale for judging something as anomalous is easy to explain.
However, in some cases, there is a trade-off between a method's interpretability and its ability to detect anomalies. Which should be prioritized depends on the specific situation. Therefore, data analysts and those implementing predictive maintenance should coordinate sufficiently to ensure mutual understanding and avoid discrepancies.
Ideal predictive maintenance is determined case by case, depending on the nature of the equipment to be maintained, budget, and resource situation. Therefore, it can be said that predictive maintenance and related services should not be introduced via a top-down mandate. Instead, sufficient discussion regarding feasibility should be held with stakeholders before introduction to find the predictive maintenance approach estimated to be most suitable for your company.
Summary
In this article, we explained the representative data analysis techniques and methods used in predictive maintenance, as well as the process for selecting them.
The key to selecting a data analysis method is not to start by directly choosing a method. If you first carefully verify whether the sensors are capturing the expected data and understand the characteristics of the observed anomalies, rework will be minimized. Once this step is completed, the appropriate techniques and specific methods to apply in sequence will become clearer.
Recently, the focus often narrows to the analysis methods themselves, such as machine learning and deep learning. However, to achieve predictive maintenance through "sensor data × data analysis," firmly grasping the fundamental points necessary for selecting appropriate methods is arguably more important than anything else.
About E-Mantech
SHENZHEN E-MANTECH CO., LIMITED was established in 2014 with a registered capital of 10 million RMB.
Its predecessor was Shenzhen Hainengda Technology Development Co., Ltd., founded in 2005.
The company is committed to becoming the preferred trading platform for electronic components in the Chinese electronics industry.
Currently, it is a first level agent for Murata in Japan, an AVX agent, a Philips power agent, a KEC agent, a Prisemi agent for Xindao, a BPS agent for Jingfeng Mingyuan, a GPI agent for New Century,
a TELINK agent for Tailing, an SGX agent, and a WE smart agent. Our products cover fields such as communication, automotive, industrial control, medical, home appliances, lighting, power supply,
security, new energy, and consumer electronics; Our business covers regions such as Hong Kong, South China, East China, North China, Central China, and Southwest China.
Contact phone number: 0755-88352448 88352450
Official website: www.himantech.com
Official account: E-Mantech
QQ:800004227
Email: service@hi-mantech.com
Address: Room 1601, Block A, Coolpad Building, Intersection of Baoshen Road and Keyuan North Road, Xili Street, Nanshan District, Shenzhen
